Mastering Blank Graph Templates for Visual Impact
In the world of data presentation, the difference between a confusing spreadsheet and a compelling story often comes down to the tools you use. For educators, designers, marketers, and content creators, having the right framework is crucial. This is where Blank Graph Templates come into play, specifically the versatile WS0084 set. This collection is not just a set of lines on paper; it is a robust design asset designed to streamline the process of data visualization. Whether you are tracking quarterly sales, illustrating scientific trends, or teaching basic math concepts, these templates provide the structural backbone needed for clear, professional communication.
The Anatomy of the WS0084 Collection
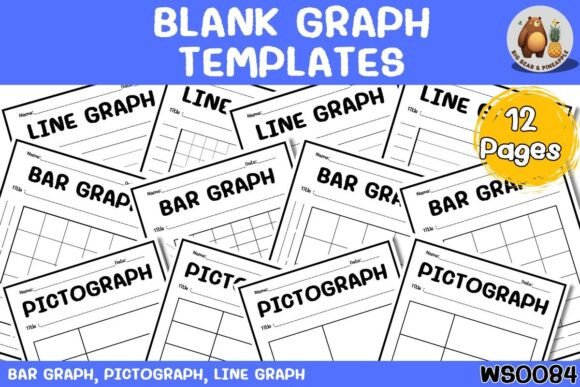
The strength of the Blank Graph Templates lies in their specificity and variety. The WS0084 set is meticulously organized to cover the three most fundamental types of data representation: Bar Graphs, Pictographs, and Line Graphs. Each category includes four sheets, ensuring you have enough space for drafts, comparisons, or multiple data sets within a single project.
The Bar Graph sheets are the workhorses of comparison. They feature clearly labeled X and Y axes and distinct grid lines. This structure is ideal for visualizing categorical data—think of comparing product sales across different regions or surveying a classroom on their favorite colors. The vertical and horizontal orientation options allow for flexibility depending on your label lengths and the space constraints of your final layout.
For a more approachable, visual appeal, the Pictograph sheets offer a creative alternative. These templates utilize symbols or pictures to represent data values, making them particularly effective for younger audiences or brands aiming for a friendly, accessible tone. With dedicated space for labeling symbols and defining their values, they are perfect for simple data sets, such as tracking favorite fruits in a class or illustrating inventory of physical goods in a creative workshop.
Finally, the Line Graph sheets are essential for showing progression. If your goal is to track changes over time—such as daily temperature fluctuations, stock market trends, or a student's test scores over a semester—these templates provide the necessary X and Y axis plotting points. The grid lines ensure precision, allowing you to connect data points accurately to reveal trends that might otherwise go unnoticed in raw numbers.
Practical Applications for Professionals and Creatives
While these templates are invaluable in a classroom setting for learning graph concepts in math and science, their utility extends far beyond education. As a content creator or small business owner, data visualization is a key component of your brand identity and marketing strategy.
Consider the entrepreneur preparing a pitch deck. Instead of scrambling to create charts from scratch in complex software, Blank Graph Templates offer a quick, handwritten, or sketched aesthetic that can convey authenticity and clarity during brainstorming sessions. For marketers, these sheets are perfect for mapping out campaign performance metrics before translating them into high-fidelity digital graphics. They allow you to focus on the data storytelling without getting bogged down by software interfaces immediately.
Furthermore, designers and bloggers can use these templates as a "low-fidelity" style asset. In an era where "modern typography" and polished digital assets dominate, a hand-drawn graph on a clean template can add a human touch to social media graphics or editorial design. It breaks the sterile look of standard web design, offering a tactile feel that engages the audience differently. Whether you are creating packaging design that requires nutritional information charts or editorial layouts that need to visualize survey results, these templates serve as a reliable starting point.
Integrating Graphs into Your Visual Hierarchy
The use of Blank Graph Templates influences more than just the data; it affects the entire visual hierarchy of your project. A well-structured graph acts as a focal point, drawing the reader's eye and breaking up large blocks of text. This is critical for readability and audience engagement.
When incorporating these templates into your workflow, think of them as premium design assets. Just as you would carefully select a serif font for body text or a sans serif font for headlines, you must choose the right graph type to match the "personality" of your data. A bar graph conveys direct comparison and assertiveness, suitable for corporate reports. A pictograph conveys friendliness and simplicity, ideal for community newsletters or children's educational materials.
Consistency is another major factor. By using a standardized set like the WS0084 Blank Graph Templates, you ensure that all visual elements across your brand materials maintain a uniform style. This consistency builds professionalism and trust. If you are a publisher or a crafter selling digital downloads, providing clients with a cohesive set of templates ensures their final output looks polished and intentional, reinforcing their brand identity.
Maximizing the Value of Your Templates
To get the most out of these graph templates, it is helpful to treat them as part of your broader font pairing strategy. While they are not a typeface themselves, they interact with text elements. When you add labels or titles to your graphs, the typography you choose must complement the grid structure. For example, a clean, modern sans serif font often works best with the sharp lines of a bar graph, while a playful handwritten font might pair better with a pictograph to maintain a casual, creative vibe.
Evaluate the fit of the template based on your specific project needs. Are you tracking data for a long-term study? The Line Graph sheets are your best bet. Are you comparing distinct categories for a quick presentation? The Bar Graph sheets offer the clearest visual separation. Testing these templates with actual data before finalizing your design is a crucial step in the creative process. It allows you to spot potential readability issues—such as overcrowded axes or unclear symbol definitions—early on.
Ultimately, Blank Graph Templates are about empowerment. They demystify the process of data visualization, making it accessible to everyone from the seasoned designer to the hobbyist organizing a community event. By integrating the WS0084 set into your toolkit, you are not just acquiring paper with lines; you are gaining a framework for clearer thinking, better communication, and more effective design. Whether for homework, business analytics, or creative exploration, these templates bridge the gap between raw data and meaningful visual stories.